How to Visualise Data from the FPL API using Python and Tableau
Hello, my fellow nerds and welcome to a post that teaches you the basics of scraping data from the FPL API using Python, saving the data into a CSV file, and then using that CSV file to visualize data in Tableau.
Sounds complicated, right? Well, it isn’t! I’ve done the hard stuff for you. There are a few requirements that you need prior to starting
- An IDE (Visual Studio Code)
- Install Python from python.org
- VS Code Python extension
- Tableau Public
- Internet Access
- A brain
This isn’t a tutorial for me to teach you how to download or install things like an IDE or a brain, but I will tell you what I am working with.
My code editor of choice is Visual Studio Code. It allows you to run code within it, and we will be running Python code today. After you have installed all of the requirements above, open up VS Code.
Open up VSCODE
The first thing that you’re going to do is to install two basic packages into VSCode. These are requests and pandas.
Requests is an HTTP client library for the Python programming language, while Pandas is a software library written for the Python programming language for data manipulation and analysis. To install them in VSCode do the following:
Click on the Terminal tab at the top of the screen. This will open a new terminal window at the bottom of the screen. Then in the terminal type the following lines.
pip install pandas
pip install requests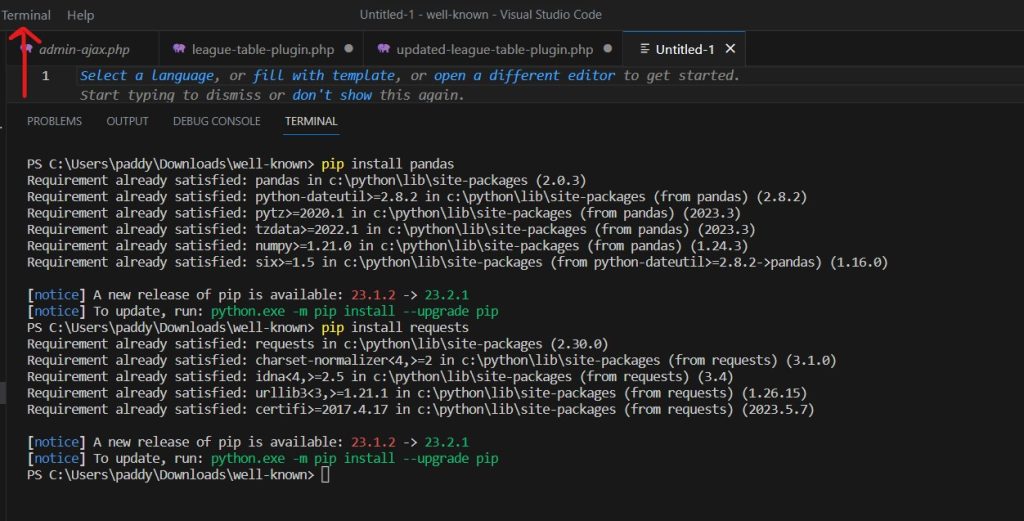
Begin Writing the Code
Write the following code into your IDE:
import requests
import pandas as pd
This imports the two libraries.
Fetch data from the URL
This queries the FPL API and gets the data in the form of a JSON file.
url = “https://fantasy.premierleague.com/api/bootstrap-static/”
response = requests.get(url)
data = response.json()
Extract ‘elements’ and save as CSV
The full script is below. You can paste this in and then run.
import requests
import pandas as pd

# Fetch data from the URL
url = "https://fantasy.premierleague.com/api/bootstrap-static/"
response = requests.get(url)
data = response.json()

# Extract 'elements' and save as CSV
try:
    elements = data.get('elements', [])
    if elements:
        df_elements = pd.DataFrame(elements)
        df_elements.to_csv("elements.csv", index=False)
    else:
        print("No 'elements' found.")
except ValueError as e:
    print(f"Couldn't convert 'elements' to DataFrame: {e}")
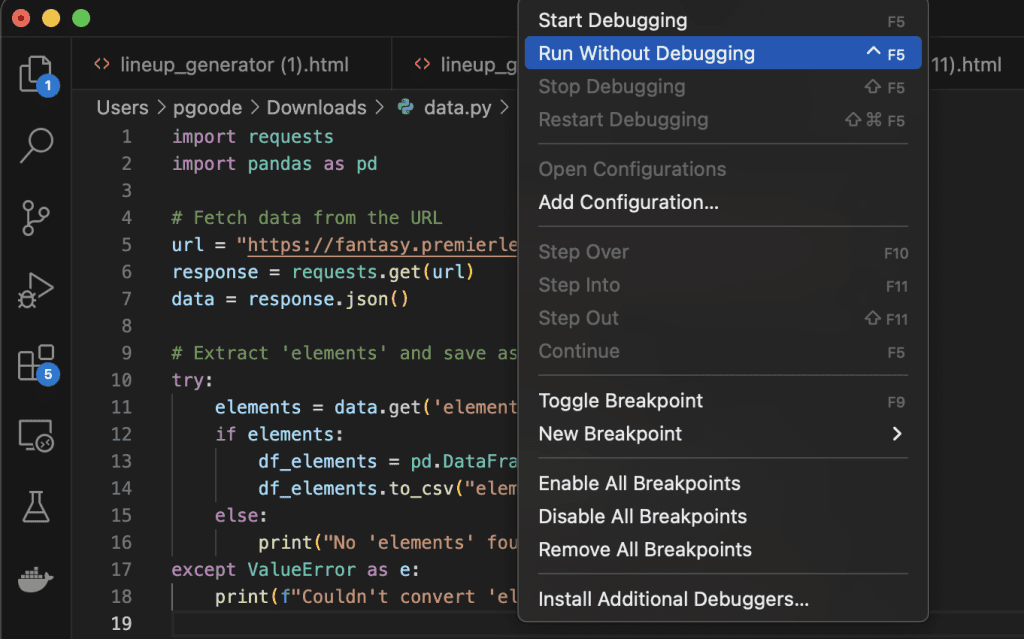
Save it. Then run this in your terminal without debugging. It shall produce the file in your directory (in my case downloads) as elements.csv
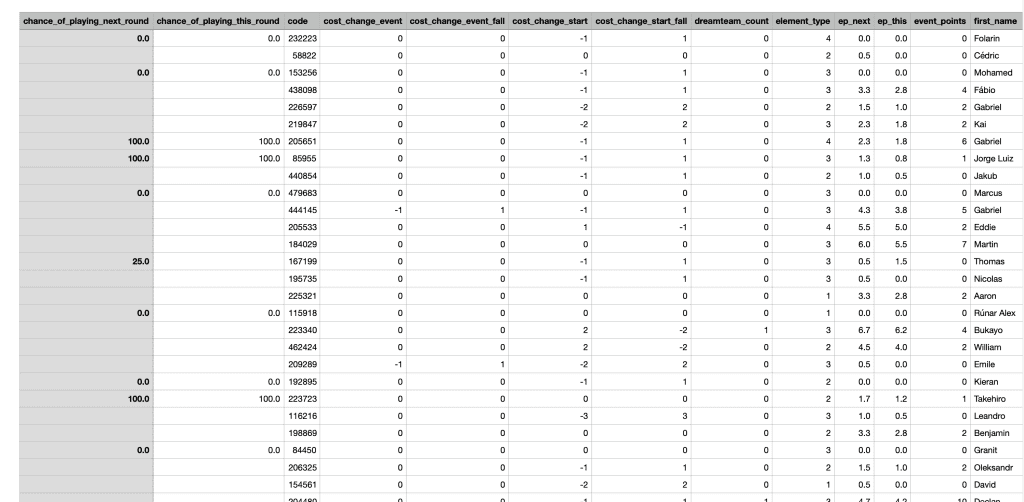
The CSV file will include all of the information that you have gathered from the API
Open up Tableau
From here, go to Tableau, You can use either Public or Desktop
On the left-hand side, click on Connect -> To a File -> Text File and choose your elements.csv file and then click on the Open button.
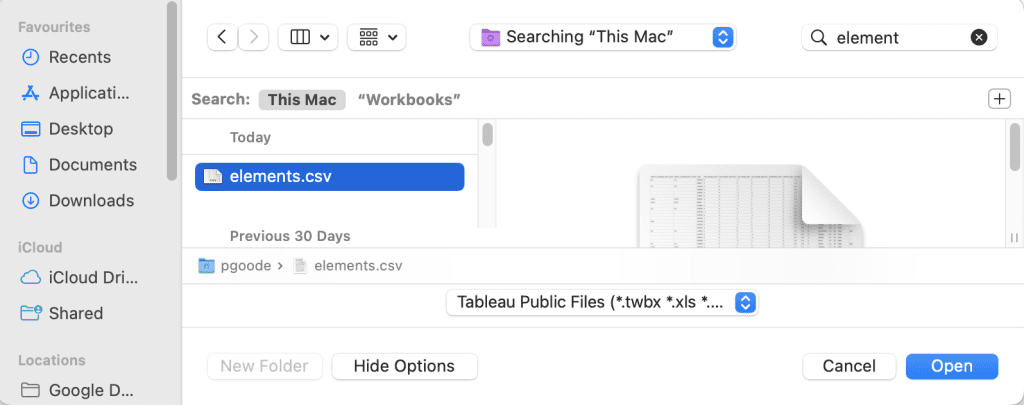
It will then open Tableau with your data source. From here click on the bottom where it says Sheet 1.
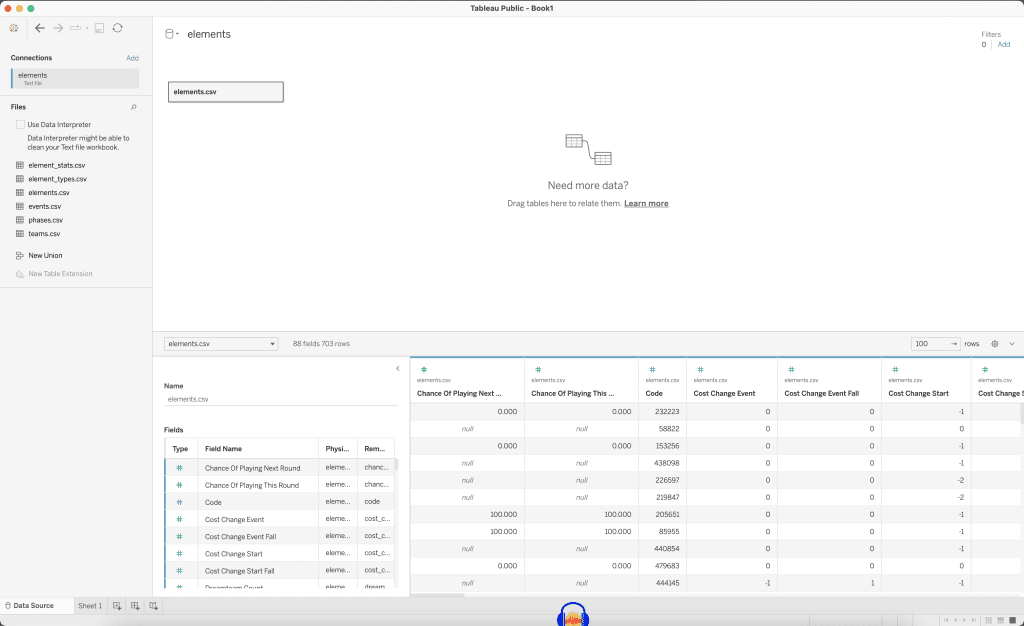
In Sheet 1 you will be given a list of tables and Measures that can be visualised by adding them to the Columns, Rows, Marks, and Filters, and choosing the type of table on the right-hand side.
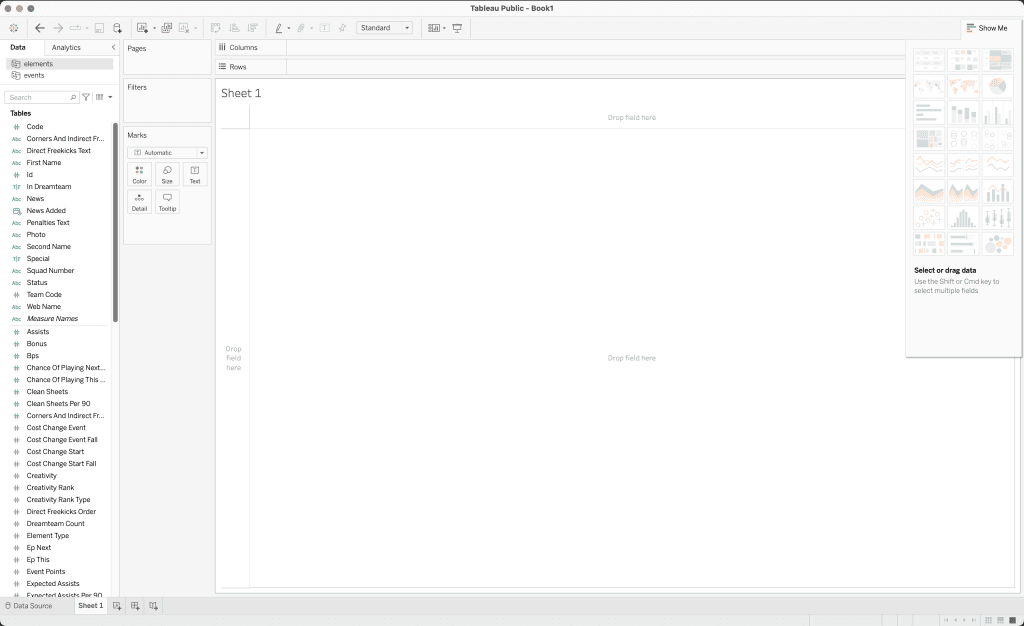
For example
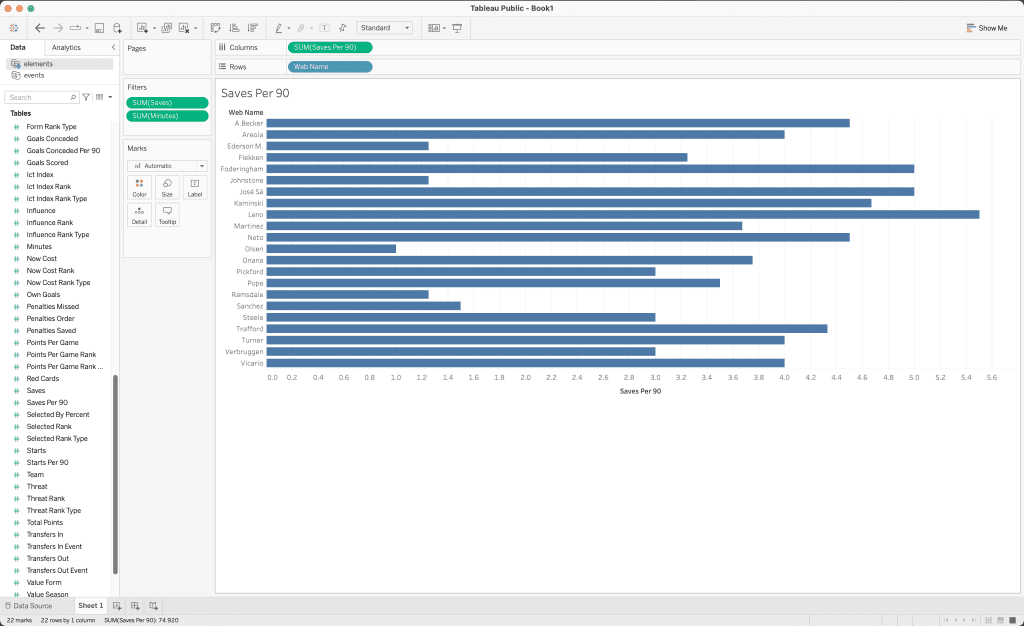
If you want to sort by the Saves Per 90, hover over the tab where the saves per 90 is on and it will sort by the amount of saves per 90 a goalkeeper makes.
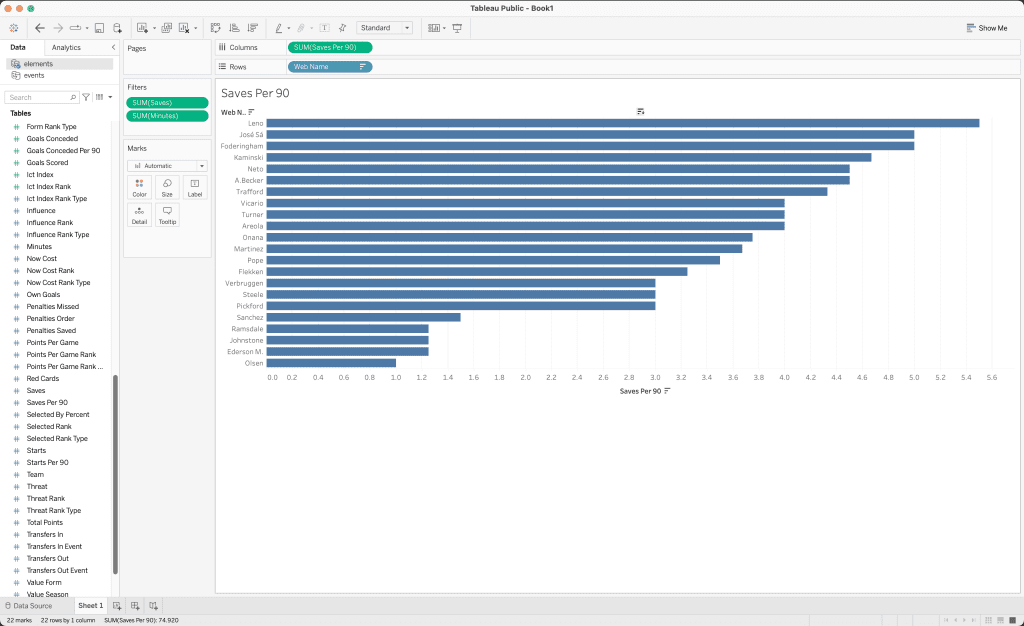
By adding in more relevant data, you can visualise important data. See for example how I have included expected goals conceded and clean sheet data, also.


